For the past few weeks, I’ve been focused on helping students visualize content. This includes anchor charts, well-chosen YouTube videos, and the use of visual reading strategies like annotation, “acting” out a play in class, or book mapping. But today as my students were grading their first grammar quiz, I began to think about how secondary teachers can help students visualize their growth.
Today, I will share how secondary teachers can implement visualization strategies; why secondary teachers should employ visualization strategies; and how visualization strategies can lead to data-driven, student-centered conversations.

This post this post may contain affiliate links. Please read the Terms of Use.
How to Implement Visualization
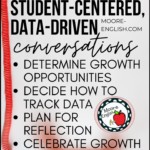
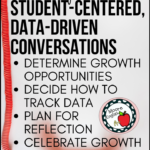
1. First, decide what growth areas you want students to visualize. In ELA, teachers can consider reading, writing, language use, speaking, or listening as growth areas. But if teachers asked students to track data in each of those areas, everyone gets overwhelmed! So narrow your focus to a critical area.
2. Next, choose a system for tracking this data. I use these data sheets. At the beginning of the year, students place these sheets at the front of their class binders. In the blank space at the bottom, each student writes a grammar and writing goal. Because students are the agents of their own growth, students are in charge of their data sheets. Regardless of which system you choose, choose a sustainable system that works for you.
3. Then, plan time for reflection. For teachers who have struggled to successfully implement growth visualization strategies, one of the main complaints is lack of time. For this reason, teachers must schedule time for reflection. Put it in the lesson plan, and make it a regular habit. Once you build this into the schedule, you and your students will internalize the behavior.
4. Celebrate growth and discuss struggles openly! While you want to schedule time for reflection, you also want to give celebration its due! I track class averages on a large graph on the wall. Each week, we update the class average and celebrate growth. When we stumble and have a down week, we have a class conversation about challenging lessons. This is a great opportunity to get some honest student feedback and also helps build classroom community.
Why You Should Implement Visualization
Visualization strategies are great because they help students see growth, invite students to take ownership of their growth, and make growth appear attainable.
Similarly, when students record their own data, they take ownership of their growth. In addition to recording our data each Friday, students also set a new goal for the next week. So students are constantly engaged in a cycle of re-evaluating their progress. Every week or so, I also make a point of talking to each student about their progress, which builds relationships and invites students to engage in meaningful dialogue about their strengths and struggles.
Another strategy I like to use with this process comes from Grant Wiggin’s and Jay McTighe’s Understanding by Design. With this strategy, as an exit slip, students simply write down what worked and what didn’t work each week. When I focus students’ responses on what worked with and what didn’t work with their goals, students own their growth but also help guide instruction.
Lastly, the process of recording goals and growth makes goals attainable. One thing I really like about these data sheets is their use of bar graphs. The bar graphs are broken down into categories: advanced, proficient, basic, and below basic. This is the same language that’s used on our state assessment. And by breaking the bar graph down into sections, students can set a goal to move from section to section. Making goals incremental makes them manageable. And when goals are manageable, students feel less intimidated and more capable.
Using Visualization with Data
In education, the phrases “data driven” and “student centered” can be frustrating. Sometimes the way these terms are used can be insulting. But neither term comes from bad intentions. Detractors of the term “data driven” often indicate that teachers cannot know students strictly through data–and that is absolutely true!
Assessment data is a minor, minor, minor part of a student. That being said, asking students to track data can be a great way to begin and focus a conversation about student growth. This kind of data is not summative, so students are more focused on growth and not on end results.
When I start these kinds of conversations with students, I usually ask them for an inference. “What does your graph show us?” The open-ended nature of the question lets students lead the conversation. When students lead the conversation, they sometimes reveal concerns I hadn’t anticipated. This is the second advantage of using visualization strategies: students become the center of the conversation.
Like “data driven,” the phrase “student centered” has its detractors, including a concern that such a phrase is pejorative or reductive. But in this context, “student centered” is an apt description of the kinds of conversations teachers are able to have with students who have been tracking their growth and goals.
How do you incorporate goal setting and data tracking into your classroom? What suggestions do you have for managing student growth and goals? Let us know in the comments.