Last year, my students read and annotated “A Poison Tree” by William Blake. We were at the mid-point in our short works unit, so students worked independently. The goal was to provide me with formative data about their progress in the unit.
It did not go well.
Despite our hard work and despite an A+ instructional spiral, students weren’t where I wanted them to be.
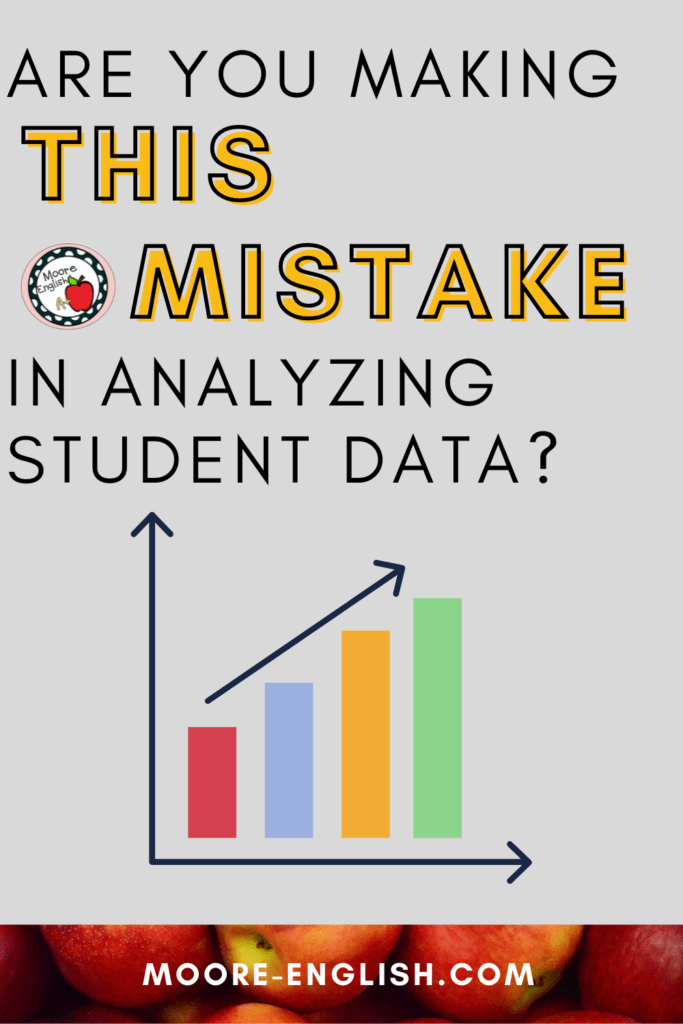
Do you see the mistakes I made? Keep reading so you too can avoid these mistakes in analyzing assessment data.

This post may contain affiliate links. Please read the Terms of Use.
Don’t Chuck Your Assessments
After giving the “A Poison Tree” formative assessment, my first instinct was to reject the assessment as “too hard” or “too confusing.”
And that was my first mistake: in data analysis, avoid the temptation to chuck your assessments.
At the end of the day, the formative assessment was right at grade-level and at the same level as the summative assessment. My team has strong backwards-design game, so the standards and skills on the mid-point formative were an appropriate extension of the pre-test and an appropriate anticipation of the standards and skills on the summative.
While the instinct to chuck the assessment is understandable, it’s counterproductive. If we just keep redesigning assessments, the quality becomes compromised. Plus, we lose the opportunity to develop year-to-year data.
By all means, evaluate the assessment for biased questions or typos. Fix those, but avoid the gut reaction to remake the entire assessment. It’s taken my team years to break the cycle of give assessment-revise assessment.
Instead, it’s more important to follow the assessment with instructional changes. Formative data should inform instruction. What worked with one group of students may not be the best approach with this group of students. What worked last year in distance learning may not be the best fit for in-person learning. And what failed last year may be just the ticket this year!
Good Growth May Not Be Linear
My second mistake in data analysis was believing that all good growth is linear. When I gave the “A Poison Tree” formative, we were halfway through our short works unit. While this was the most formal formative, I’d been collecting formative data throughout the unit. Some data was anecdotal and based on conversations with students. Some of the data came from informal exit tickets and checks for understanding, and a lot of the data came from student annotations and in-class discussions.
While there was a lot of good coming out of the formative data I had collected, the most important part of data analysis is action. What the formative data indicated was a need to group students differently during in-class activities. It also indicated that my favorite poetry spiral may not have been the best fit for this class. (In hindsight, I should have chosen this collection of poems about hunting and deer.)
Perhaps more importantly, I had also not noticed the good in pursuit of the perfect. My students were growing. While their scores on the formative checkpoint weren’t everything I dreamed of, they were showing growth. I forgot that good growth doesn’t have to be linear. Good growth doesn’t have to look like Chart A. Sometimes good growth looks like Chart B. Either way, students end up in the same place!

Data Analysis Should Celebrate, Too
My final error in data analysis was not celebrating everything that went well! Chances are that formative data shows some kind of growth or improvement. In this context, my students did an excellent job on the questions about mood and tone!
Celebrating those victories with students and with your team is an important part of building momentum! Self-efficacy comes from a belief that improvement is possible. Helping students think metacognitively about their growth is an important piece of the puzzle.
Similarly, thinking about your instruction is an important part of being a reflective practitioner. Knowing what you have done well will help you build on those lessons in the future!