When I was in college, it took me a long time to decide what I would teach: I love learning and like working with young people, so I was open to pretty much everything.
Except math.
While I considered teaching elementary school, social studies, and language arts, I never considered being a math teacher. My word sense is strong, but my number sense is fuzzy at best and nonexistent at worst. As an anecdote, my mother and I once had a very involved conversation about my age because I couldn’t make the math work.
As a teacher, though, I learned very quickly that it is poor form to bad mouth another teacher’s class. I love teaching language arts, and I never want someone to characterize it as “useless” or “fluff.” For this reason, I work really hard to shut down student conversations focused on complaining about other teachers, classes, and subjects. (That’s just one of the unspoken rules of teaching.)
I also learned that some of my students love math. They can explain proofs and equations to one another. They speak fluent calculus. I am consistently impressed with some of my students’ number sense.
With this in mind, I have been looking for opportunities to reach some of my math-minded students. More often than not, my students who excel at math tell me they find language arts frustrating because interpretation rarely has a finite answer. Well, I don’t have a perfect way to make language arts number-based, but I have found some ways to bring number sense into the English language arts classroom.
This post this post may contain affiliate links. Please read the Terms of Use.
Math, Charts, and Graphs, Oh my!
When I started looking for opportunities to incorporate number sense in my language arts instruction, my first thought was text features. When choosing texts to read in the classroom, I’m almost always looking for a rich text with meaningful text features. Since I do this anyway, I just started looking for readings that had charts and graphs.
This gives my students an opportunity to practice interpretation and analysis in the context of math, which they sometimes view as interpretation-free.
To build on this, when students are working on projects, presentations, and papers, I often ask them to design their own text features. This provides students with an opportunity to conduct their own research (if needed) or to aggregate credible, reliable research from outside sources. As students design their text feature and make it a meaningful part of their work, they are still drawing on ELA skills, but they are also exercising their quantitative thinking.
Sometimes finding meaningful or age-appropriate data sets can be tricky, so I turn to the New York Times Learning Network. The NYT Learning Network publishes a segment called What’s Going on in this Graph? In particular, this is a great source for brief data sets that can be used for bell ringers. Furthermore, the topics are relevant to students, so they are engaged in making inferences and other ELA skills while in the comfortable context of math.
Make Number Sense Part of Research
Additionally, I began by thinking about the role of data in research. As my students conduct research, their interests and goals usually inform their purpose. For this reason, it can be tricky to find credible, reliable research. That’s where these tools come in!

First, a student introduced me to Our World in Data, a project of the Global Change Data Lab and Oxford University. OWD aggregates data from a variety of credible sources to produce reports, charts, and graphs. Each data set focuses on a problem facing the world (see image). Overall, the site insists that humans can use “research and data to make progress against the world’s largest problems.” In my classroom, students used this site during research. We also used this to research some of the problems facing characters in our class novels.
Similarly, Pew Research Center is a great resource for bringing data and math into the English language arts classroom. Pew describes itself as “a nonpartisan fact tank that informs the public about the issues, attitudes and trends shaping the world.” With this resource, students can conduct and participate in research.
Overall, incorporating data-rich resources like OWD and Pew helps students understand the relevance of research. Similarly, by incorporating a little number sense in student research and writing, I’m able to engage some of my math-minded students.
Rubrics Require Number Sense
Overwhelmingly, when student moan about English language arts, they are expressing frustrations with interpretation and analysis. Math is formulaic, and there’s usually one right answer. However, in written analysis, nearly anything is possible if writers organize their thoughts, write coherently, and use evidence to support claims.
Rubrics are a great way to take some of the interpretative wiggle room out of writing instruction. With rubrics, students have a clear bright line for what success looks like. In addition, using rubrics makes writing more efficient and prevents student arguments about grades.
When I introduce a new writing activity, I usually provide students with an exemplar. Then, we read the exemplar and grade it together on the rubric, which exposes students to the grading criteria and to some metacognition. As we begin writing, students use the rubric to self-assess and set goals. All students, not just my math-minded learners, value this kind of clarity. Overall, this helps students make writing and interpretation a little more concrete. Check out these posts and resources for making grading a little easier:
- My favorite rubric!
- Google Classroom Tips
- Grading Virtually and Efficiently
- The Laundry Approach to Grading
- High School Writing and Grammar Data Sheets
Quantifying Revision
Additionally, my students often resist the revision and editing processes. While using rubrics can be a meaningful way to help students visualize their progress and set goals, sometimes that is not enough to actually get my students to revise.
For this reason, when I have time, I turn to Voyant-Tools. I love Voyant-Tools so much, I’ve written an entire post about it, so I’ll be brief. Basically, students upload their writing to Voyant, the program analyzes students writing, and breaks the text down into data about word choice, text complexity, and sentence structure. The image below shows how Voyant broke down Jane Austen’s novels.
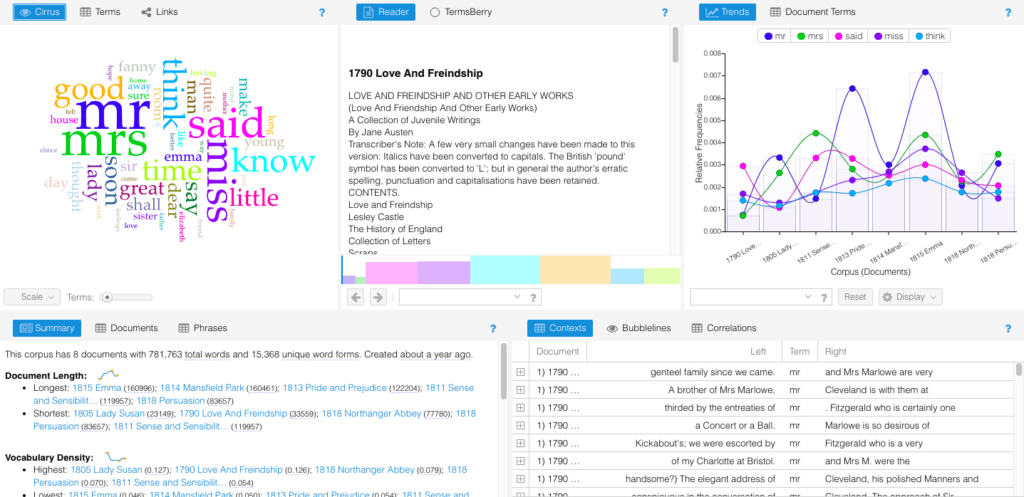
There are countless ways to click through and sort the data. Giving students some time to reflect on the data Voyant shares is a great way to help students quantify their writing, adjust their goals, and engage them with a little math.
Last Thoughts
As a final thought, my students often fall into the faulty binary that they are either good a math and science or they’re good at reading and writing. Sometimes I also fall into that binary thinking. However, it’s important to help students see the value in all types of learning. Incorporating number sense into English language arts helps fight against this binary thought process and shows students how different contents overlap and interact with one another, supporting and strengthening each other.
What are your strategies for incorporating number sense and data into your language arts classroom?

